Both the percent depth dose (PDD) and the tissue phantom ratio (TPR) describe how the delivered dose changes along the beam's central axis as a function of depth. While either equation can be used to calculate monitor units (MU) or dose using the corrections-based formulae, the PDD is ideal for surface-based treatments while the TPR is ideal for isocentric-based calculations. This is primarily because of the way they are measured. For PDD measurements, the SSD is kept constant and the detector moves to measure dose vs. depth. On the other hand, for TPR measurements the SAD is kept constant, meaning that the water tank must be moved (or filled/drained) to measure dose vs. depth. One could measure TPR values, but typically in practice only PDD values are measured, and then converted to TPR values. In this lab we will derive the relationship between the two depth-dose ratios.
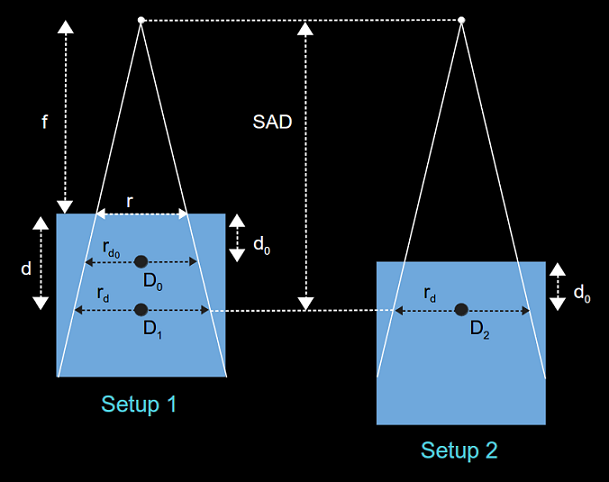
Consider the two setups shown in the figure below. Setup 1 by itself is adequate for PDD measurement: keep the SDD (f) constant, move the detector to different depths d, and measure the dose relative to that at a reference depth d_0. To measure the TPR we need to compare the dose at depth d to a reference depth d_0, but with the SAD kept constant. So we also need setup 2, which displays the measurement conditions for TPR reference depth dose. Given this setup and measurements, derive the relationship between the TPR and PDD:
TPR(d,r_d) = \frac{PDD(d,r,f)}{100} \frac{S_p(r_{d_0})}{S_p(r_d)} \frac{(f+d)^2}{(f+d_0)^2}
Let's start the derivation by restating our conditions in equation form. From setup 1 we can measure the PDD:
\frac{PDD(d,r,f)}{100} = \frac{D_1}{D_0}
If we combine setups 1 & 2 we can measure the TPR:
TPR(d,r_d) = \frac{D_1}{D_2}
Which in terms of PDD is:
TPR(d,r_d) = \frac{D_1}{D_2} = \frac{PDD(d,r,f)}{100} \frac{D_0}{D_2}
So all that we need now is the relationship between D_0 and D_2, and we can finish our derivation of the PDD-TPR conversion equation.
Let's calculate the doses D_0 and D_2 using the corrections-based formula for surface-based treatments (i.e. with PDD). We could also use the isocentric-based equation and obtain the same results (more on that later). Assuming that the beam is calibrated to deliver k cGy/MU to the calibration point (depth = d_0), the point doses for a given MU can be calculated as follows:
D_0 = MU \times k \times S_c(r_d) \times S_p(r_{d_0}) \times PDD(d_0,r,f) \times ISF_0
D_2 = MU \times k \times S_c(r_d) \times S_p(r_d) \times PDD(d_0,r_{d_0},f+d_0) \times ISF_2
Where ISF_0 and ISF_2 are the inverse square factors for dose points D_0 and D_2, respectively:
ISF_0 = \frac{(f+d_0)^2}{(f+d_0)^2} = 1
ISF_2 = \frac{(f+d_0)^2}{(f+d)^2}
Our initial dose ratio is therefore:
\frac{D_0}{D_2} = \frac{S_p(r_{d_0}) \times PDD(d_0,r,f) \times ISF_0}{S_p(r_d) \times PDD(d_0,r_{d_0},f+d_0) \times ISF_2}
Since the PDD in both cases is at the reference depth d_0, they are both equal to 100%, regardless of field size and SSD:
PDD(d_0,r,f) = PDD(d_0,r_{d_0},f+d_0) = 100
Which simplifies our equation further:
\frac{D_0}{D_2} = \frac{S_p(r_{d_0}) \times ISF_0}{S_p(r_d) \times ISF_2}
Substitution of the inverse square factors results in:
\frac{D_0}{D_2} = \frac{S_p(r_{d_0})}{S_p(r_d)} \frac{(f+d)^2}{(f+d_0)^2}
Returning again to our initial TPR equation:
TPR(d,r_d) = \frac{PDD(d,r,f)}{100} \frac{D_0}{D_2}
We just need to substitute in our previous results, leading to:
TPR(d,r_d) = \frac{PDD(d,r,f)}{100} \frac{S_p(r_{d_0})}{S_p(r_d)} \frac{(f+d)^2}{(f+d_0)^2}
Which is our final derivation of the PDD-TPR conversion equation.
A Side Note About Isocentric-Based Calculation
I mentioned earlier that we could in fact use the isocentric-based calculation and obtain the same result; let's evaluate that statement here. When looking at the corrections-based calculation equations for D_0 and D_2, the only thing that changes between the surface-based and isocentric-based techniques if the depth-dose values:
PDD(d_0,r,f) \rightarrow TPR(d_0,r_{d_0})
PDD(d_0,r_{d_0},f+d_0) \rightarrow TPR(d_0,r_d)
As with the PDD values, the TPR values are both at the reference depth d_0, and are therefore both equal to 100%, regardless of field size. So the same result would have been achieved if the isocentric-based equations were used.